Are you a music lover who wants to create a visual representation of your listening habits on Spotify? Look no further! In this guide, I’ll walk you through the steps to make a Spotify Pie Chart for 2023 using the latest features and tools.
Understanding Pie Charts
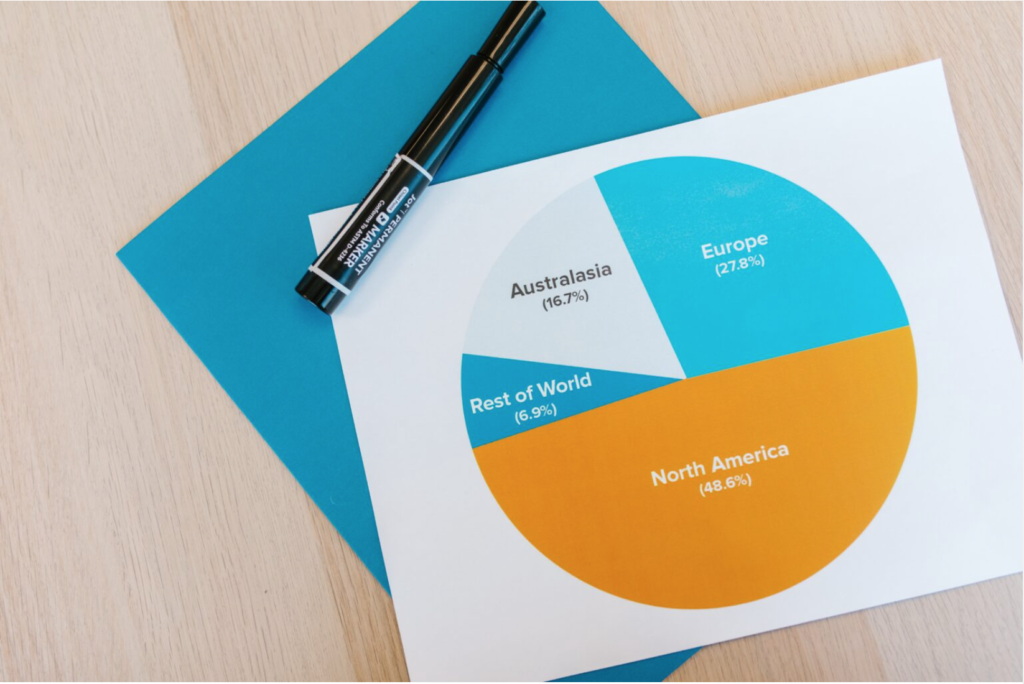
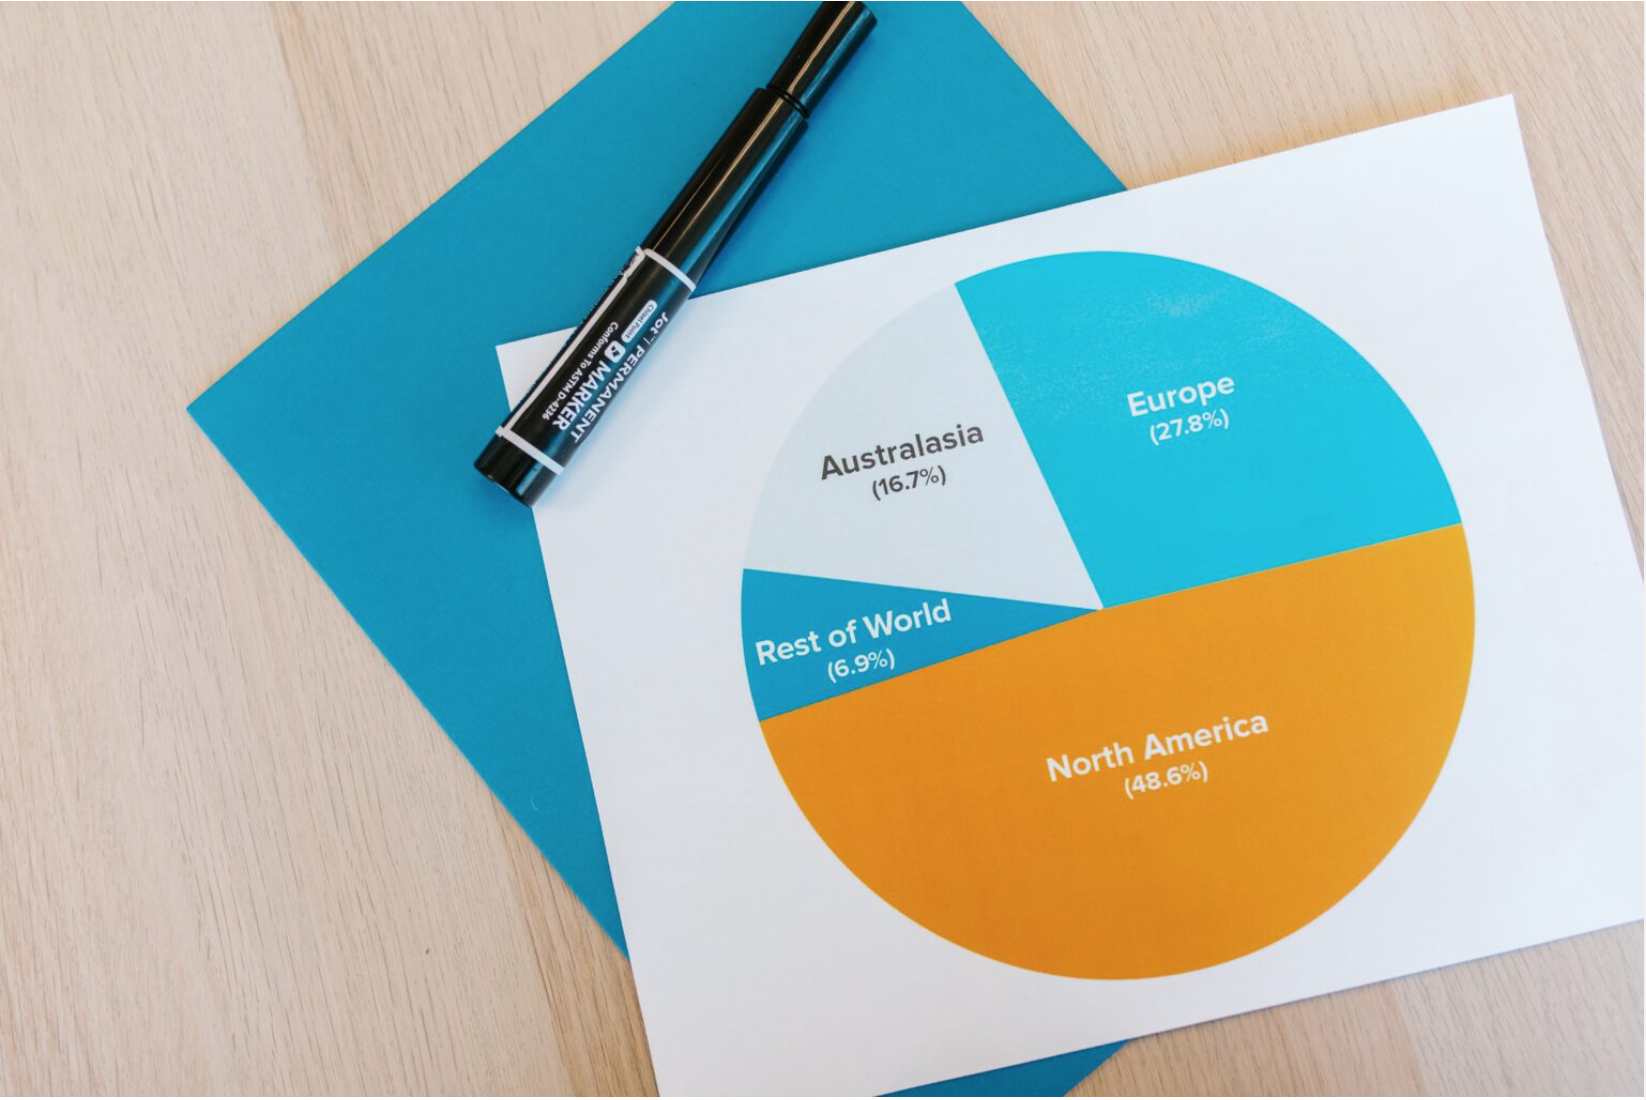
Before we dive into the specifics of creating a Spotify Pie Chart, let’s take a moment to understand what a Pie Chart is. A Pie Chart is a circular graphical representation of data that is divided into slices to show relative sizes of the different values. Each slice represents a proportion of the whole, and the total of all the slices equals 100%.
Why Make a Spotify Pie Chart?
Spotify is one of the most popular music streaming services worldwide, with millions of active users. With Spotify Pie Charts, you can get a visual representation of your listening habits, including your most played artists, genres, and songs. You can use this information to explore new music or share your music taste with your friends.
